
An SEO report is where you pull together all the data on your website's performance in search engines to show what's working, justify your strategy, and map out what to do next. It’s about taking those complex numbers—like organic traffic, keyword rankings, and backlink growth—and turning them into a clear story about how your SEO work is impacting the business. A great report is more than just data; it's a goldmine of actionable insights.
Why Your SEO Report Is More Than Just Numbers

Let's be real. Most SEO reports are dense spreadsheets that get a quick skim before being filed away forever. They end up being a box-checking exercise, not a valuable business tool.
The biggest problem? These reports usually focus on what happened ("our rankings went up") instead of explaining why it matters ("our higher rankings for 'buy now' keywords led to a 15% jump in qualified leads"). That's the difference between a report that gets ignored and one that gets attention.
A truly effective SEO report is your most powerful tool for communication and strategy. It acts as the bridge connecting your technical work—like fixing crawl errors or building links—to the results that leadership actually cares about, like revenue, new customers, and market share.
Connecting SEO Activities to Business ROI
Your report is your chance to prove your worth. When you frame your data around actual business goals, you can completely change the conversation from vanity metrics to meaningful outcomes.
- Justify Budgets: Don't just show traffic growth. Show how that traffic turned into leads or sales, proving the ROI of your SEO spend.
- Showcase Progress: A good report tells a story of progress over time. It celebrates the wins and honestly addresses the challenges, all while laying out a clear plan for the future.
- Drive Strategy: The insights you pull from the report can guide wider marketing decisions, helping the whole team understand what content is hitting the mark and which search terms signal real buying intent.
The core reason we even create these reports is because search is a massive driver of business growth. Organic search is responsible for over 53% of all website traffic. Plus, for 61% of B2B marketers, SEO brings in more leads than any other marketing channel. This just goes to show how crucial it is to have reports that tie your SEO tactics directly to these powerful results.
A great report doesn't just present data; it tells a story. It should answer three key questions for anyone reading it: Where are we now? How did we get here? Where are we going next?
A Tool for Alignment and Trust
At the end of the day, a solid report builds trust. It proves you're accountable for the results and transparent about performance, good or bad.
This is also a huge part of managing client expectations effectively, as it helps you set realistic goals and show clear, steady progress. When stakeholders can see the direct line between your SEO efforts and their bottom line, your report stops being a simple update and becomes an essential strategic document.
Laying the Groundwork for Your Report
Before you dive into a single spreadsheet or open a single analytics tool, let's talk strategy. Honestly, the most crucial part of building an SEO report happens right here, before you even pull any data. Without a solid plan, you’re just collecting numbers. With one, you're telling a story that drives action.
So, the first question I always ask myself is: Who am I building this for? The answer completely changes the game.
An SEO report for your CEO or a C-level executive needs to be short, sweet, and to the point. They care about the big picture—how SEO is impacting revenue, lead generation, and market share. Forget the jargon; focus on the bottom line.
But if you're reporting to your fellow marketers or the content team? That’s when you get into the weeds. They’ll want to know which blog posts are killing it, how our rankings for those "money" keywords are trending, and what technical gremlins might be holding us back. Tailoring the report to the audience is everything. It's the difference between a report that gets a quick glance and one that gets bookmarked and discussed.
Choosing Your Key Metrics
Once you know who you’re talking to, you can start picking the right metrics to tell your story. Every report is different, but there are a few core components that I almost always include to give a complete view of our SEO health.
Here's what I consider the "must-haves":
- Organic Performance: This is your headline number. It's all about organic traffic, how many new people are finding you through search, and what they do once they land on your site.
- Keyword Rankings: You have to know where you stand for the keywords that matter. I always focus on the overall trend—are we moving up or down over the month or quarter? Daily blips are just noise. If you want to get really granular, we have a whole guide on how to track keyword rankings.
- Backlink Health: A quick look at new links gained and any important ones lost tells a story about your site's authority. Quality over quantity is the name of the game here.
- Technical SEO Check-up: I always include a snapshot from a recent site audit. This means flagging any critical errors, checking in on Core Web Vitals, and reporting the overall site health score.
Remember, the goal isn't to drown your audience in data. It’s to pick the handful of metrics that best show progress against the goals everyone agreed on. More often than not, less is more.
A simple visual can often tell a story much faster than a table of numbers.
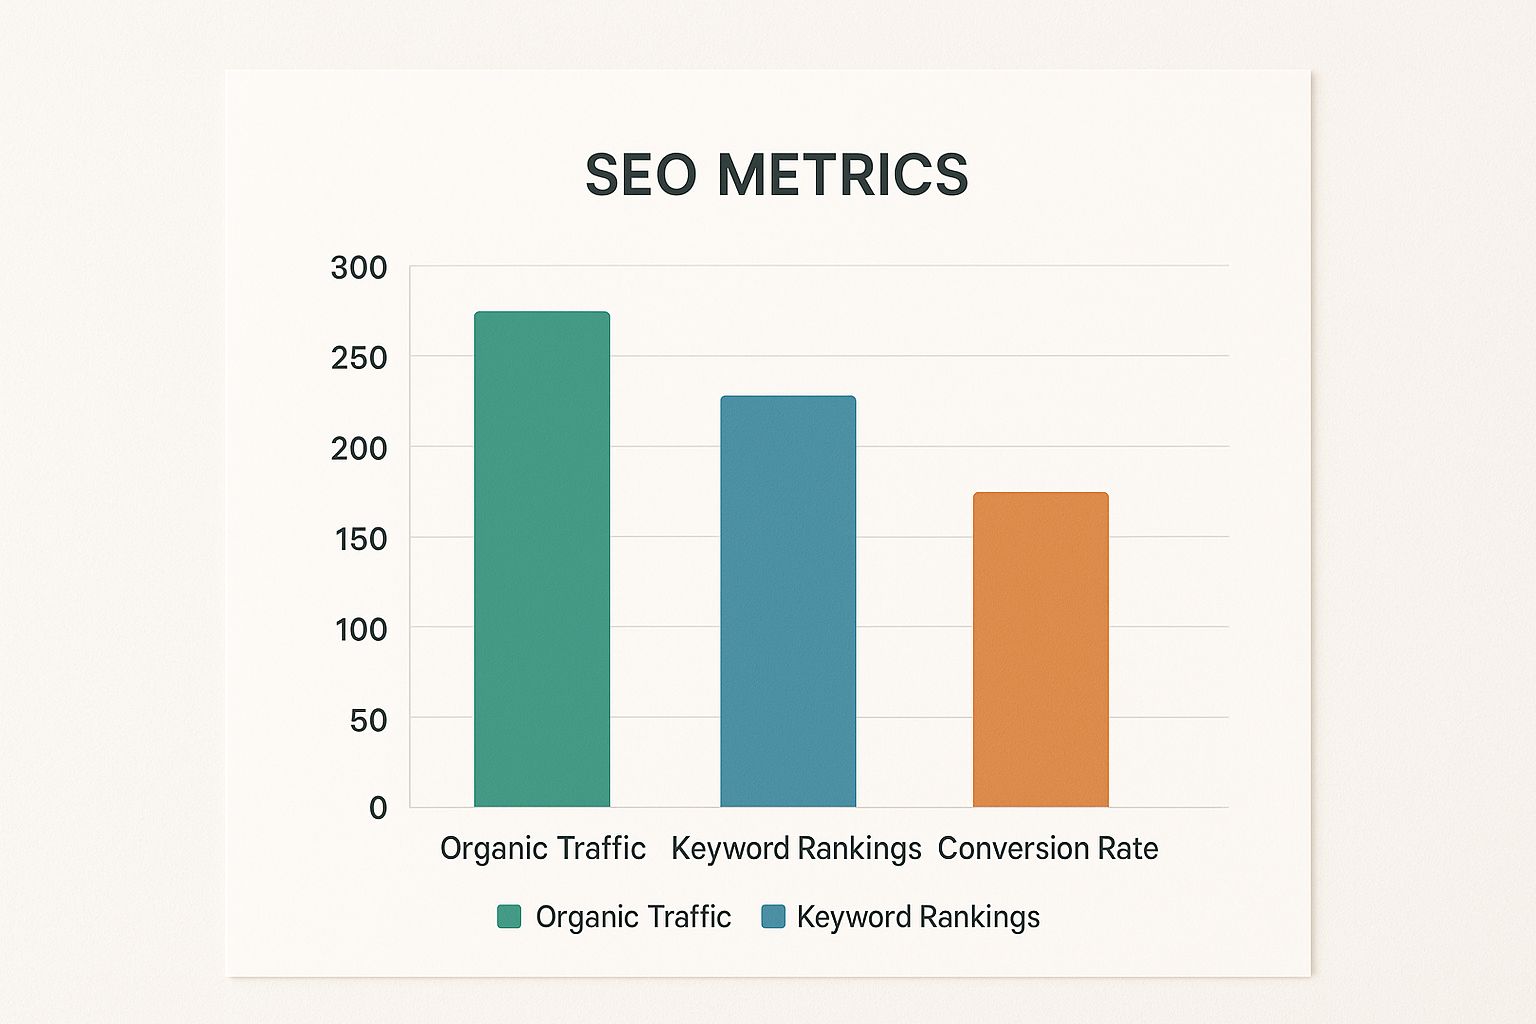
This chart, for example, immediately shows that while traffic and rankings are strong, our conversion rate isn't keeping up. That's a clear signal that we need to focus on improving the experience once users get to our site.
Core SEO Metrics and What They Really Mean
To help you get started, here's a quick cheat sheet for the most common metrics you'll be pulling and what they actually tell you.
| Metric | What It Tells You | Why It Matters for Your Report |
|---|---|---|
| Organic Traffic | The number of visitors who found your site through a search engine. | This is the most direct measure of your SEO's reach and visibility. |
| Keyword Rankings | Your website's position in search results for specific target keywords. | Shows how visible you are for the terms your customers are searching for. |
| Click-Through Rate (CTR) | The percentage of people who click your link after seeing it in search results. | A high CTR suggests your titles and descriptions are compelling and relevant. |
| Bounce Rate | The percentage of visitors who leave your site after viewing only one page. | Can indicate a mismatch between search intent and your content. |
| Conversion Rate | The percentage of organic visitors who complete a desired action (e.g., buy, sign up). | This connects your SEO efforts directly to business goals like leads or sales. |
| Backlinks | The number of links from other websites pointing to yours. | A key factor in building your site's authority and trust with search engines. |
Think of this table as your starting lineup. You might not use every metric in every report, but knowing what they mean helps you choose the right players for the right game.
2. Gathering Data Without Losing Your Mind
Alright, let's get into the nitty-gritty. Pulling all the data for your SEO report can feel like trying to drink from a firehose. You’ve got numbers scattered across Google Analytics, Search Console, Ahrefs, Semrush, and who knows where else.
The trick is to be methodical. Your goal isn't to create a massive data dump; it's to find the specific evidence that tells a clear story. Think of yourself as a detective searching for clues. Each tool holds a different piece of the puzzle, and your job is to put them together.
For example, Google Analytics 4 (GA4) is your go-to for seeing how people behave once they land on your site. Don't just report the top-line organic traffic number and call it a day. Dig into the engagement rates for your most important landing pages and track the conversions coming directly from organic search. This is how you connect your SEO efforts to real business results.
This GA4 dashboard gives you a clean snapshot of user acquisition, letting you see which channels are bringing in the most valuable visitors.

From a view like this, you can spot trends in user sessions and engagement at a glance. It's a fantastic starting point for the performance section of any report.
Core Data Sources and What to Pull
To avoid falling down a data rabbit hole, know exactly what you need from each tool before you even log in. Trust me, it saves a ton of time.
- Google Search Console (GSC): This one is non-negotiable. Grab your top-performing search queries, landing page clicks, impressions, and your site's average click-through rate (CTR). GSC is also where you'll find critical info on Core Web Vitals and any indexing problems.
- Google Analytics 4 (GA4): Here, you're focused on what happens after the click. Track organic traffic trends over time, how engaged those users are, and any goal completions or conversions that came from organic search.
- Ahrefs or Semrush: Use these powerhouses for competitive intel and backlink analysis. You'll want to report on new and lost referring domains, the overall health of your backlink profile, and how your keyword rankings are shifting.
When it comes to efficiently gathering this data, mastering automated keyword research for SEO success can be a game-changer, saving you time and uncovering deeper insights.
Cleaning and Validating Your Data
Raw data is almost always messy. Before a single number makes it into your report, you have to clean it up. A classic problem is skewed data from bot traffic or your own team's activity. Always make sure your analytics view is filtering out internal IP addresses to get a true picture of real user behavior.
You also have to be ready for discrepancies between tools. For instance, the click data in GSC will rarely match your organic session data in GA4 perfectly. That's okay—they measure different things. The real key is to be consistent. Pick one source for each metric and stick with it month after month.
A huge part of building a trustworthy SEO report is knowing which numbers to lean on. Cross-reference data when you can, but understand that different tools have different ways of measuring things. Consistency is far more important than perfect alignment.
SEO is a complex field, and a good report reflects that by pulling from multiple sources. Think about it: with over 99,000 Google searches every single second, the sheer volume of activity is staggering. It's also why optimizing for valuable SERP features matters so much—a featured snippet can snatch up to a 42.9% click-through rate.
Turning Your Raw Data Into a Story That Clicks
https://www.youtube.com/embed/8NjBWQIaf3I
So, you’ve wrestled with the APIs, wrangled the spreadsheets, and now you’re staring at a mountain of data. This is where the real magic happens. This is the moment you stop being a data-puller and start being an SEO strategist.
Let's be honest, nobody gets excited about a spreadsheet full of numbers. Your real value is in translating that data into a clear story about what's working, what's not, and what we should do next. It's about connecting the dots for everyone else.
Think of it this way: the data tells you what happened. For example, "organic traffic went up by 10%." Your job is to explain the so what? As in, "That 10% traffic spike came directly from our new blog series on beginner-friendly topics. We're now reaching a whole new audience that we can guide toward becoming future customers." See the difference?
Weaving Your Narrative
A great report tells a story. It has a beginning (where we were), a middle (what happened), and an end (where we're going). It’s not just a victory lap. It’s an honest look at performance—celebrating the wins but also facing the challenges head-on.
For instance, instead of just flagging a keyword drop, frame it with context and a plan. You could say something like:
"I noticed our main services page slipped a few spots this month. After digging in, it looks like our top competitor just overhauled their page and landed a couple of powerful new backlinks. My plan is to fight back by updating our page with fresh case studies and launching a targeted link-building push to get those rankings back."
This kind of analysis is so much more valuable. It shows you're not just watching the numbers; you’ve diagnosed the problem and already have a solution ready to go. That’s how you become an indispensable part of the team.
Making It Visual (With Commentary)
Let's face it, our brains are wired for visuals. Charts and graphs are your secret weapons for making complex data instantly understandable. They can show a trend or highlight a key insight far faster than a dense paragraph ever could.
But a chart on its own is just a pretty picture. It needs your voice. Always add a short, punchy bit of commentary to explain what people are looking at.
My Two Cents: When you're adding text to a chart, stick to the single most important takeaway. Don't overwhelm people by explaining every little dip and spike. Ask yourself: "What's the one thing I need them to remember from this?" and write that.
For example, next to a graph showing a big jump in organic conversions, you could write: "This 25% surge in conversions lines up perfectly with the launch of our revamped product pages. It's clear proof that the new, stronger calls-to-action are doing their job."
Keeping Your Reporting Modern
Search doesn't stand still, and neither should our reports. The game is changing fast. Today, we're talking about AI-driven insights, user experience signals, and building real authority. Reporting isn't just about keyword positions anymore; it's a much bigger conversation covering technical site health, how users behave on our site, and E-E-A-T. If you're curious about this shift, the State of Organic Marketing report is a great read.
This means your story might include new plot points. You might talk about how you’ve used AI analysis to refine key articles or how you’ve improved page speed to boost user engagement. Bringing these modern tactics into your reporting shows you're not just keeping up—you're staying ahead of the curve. And speaking of staying ahead, a strong narrative is fundamental to great content, too. You can learn more in our guide to content marketing best practices.
Presenting Your Findings for Maximum Impact

You’ve already done the heavy lifting—you crunched the numbers, found the story in the data, and put it all together. But now comes the moment of truth: presenting your findings. A killer report can completely fizzle out with a weak delivery, so how you present is just as important as what you're presenting.
The secret is to know your audience. If I'm walking into a room with the C-suite, I get straight to the point with a strong executive summary. They need the bottom line, fast. Something like, "Our SEO work last quarter drove a $50,000 increase in sales-qualified leads."
But for the marketing team? That's a different conversation. We'll get into the nitty-gritty. We’ll look at exactly which blog posts brought in those leads, break down keyword wins and losses, and kick around ideas for how to do it again, but better. Your presentation is your stage to sell your strategy and get everyone excited for what’s next.
Mastering the Art of Delivery
No matter who you’re talking to, your real job is to pivot the conversation from "what happened" to "what we'll do next." This isn't a history lesson. You need to guide the discussion, not just read your slides.
To make sure your insights land, lean into good data visualization best practices. When you use clear charts and graphs, you turn a spreadsheet of numbers into a convincing story. It just makes the information easier to digest and remember.
Come prepared for the hard questions. If organic traffic took a hit, you should be the one to bring it up first. Explain why you think it happened—maybe a competitor launched a big campaign or a Google update shook things up—and immediately pivot to your plan to fix it. That kind of honesty builds a ton of trust.
The best presentations aren't just a review of the past. They're a launchpad for the future. You’re there to connect the dots between the data and the decisions, showing everyone the path forward.
Learning to handle pushback is also a critical skill. If a stakeholder questions your data or your conclusions, don't get defensive. Thank them for the question—it shows they're engaged! Use it as a chance to explain your reasoning in more detail. Treat it like a collaborative brainstorm, not an interrogation.
Shifting from Reporting to Strategizing
The last part of your meeting should be entirely focused on the future. This is where you lay out your recommendations and get everyone in the room nodding along with the game plan.
Here’s how you can frame your key takeaways:
- Highlighting the Wins: "Our new blog content led to a 30% jump in organic traffic, which tells me there’s a real appetite for this topic. I think we should double down and build out a full pillar page to own this space."
- Addressing the Setbacks: "We slipped a few spots for a major keyword, and it looks like a new competitor is the cause. My immediate plan is to update our existing page and build a few high-authority links to reclaim our position."
- Defining the Next Steps: "Based on everything we've seen, our top three priorities for next quarter are X, Y, and Z. This will keep our momentum going and help us jump on the new opportunities we've uncovered."
When you focus on clear, actionable plans, you turn a boring report meeting into a genuinely productive strategy session. This is how you demonstrate your value beyond just pulling numbers and how your insights actually fuel business growth. For more great ideas on boosting your numbers, check out these website traffic increase tips.
Answering Those Nagging SEO Reporting Questions
Once you start building reports, a few practical questions always pop up. Answering them well is the difference between creating a report that gets glanced at and one that actually shapes strategy.
Let's dig into some of the most common questions I hear. Getting these right will make your reports clearer, more effective, and a lot more useful to everyone who reads them.
How Often Should I Actually Send This Thing?
There’s no magic number here. The right cadence for your SEO report really hinges on who you're talking to and what they need to know.
Here’s a breakdown that works for most situations:
- Monthly Reports: This is the go-to for a reason. It's the sweet spot for most clients and internal marketing teams. A month gives you enough data to spot real trends without getting bogged down by the daily ups and downs of search.
- Quarterly Reports: Perfect for the C-suite or leadership. They don’t need the nitty-gritty; they want the big picture. A quarterly report is ideal for connecting SEO performance to major business goals like revenue growth or stealing market share.
- Weekly Updates: Think of these as quick, informal check-ins. They’re super useful during a high-stakes project, like a major website migration or a big product launch. You're usually just tracking a handful of critical metrics to make sure things are on track.
The easiest way to get this right? Just ask. A simple conversation about what stakeholders prefer ensures your hard work lands at the perfect time.
Honestly, my advice is to start with monthly reports. It's the best balance of being timely while having enough data to tell a real story. Sending too many reports can be just as counterproductive as not sending enough.
What's the Best Tool for Making SEO Reports?
I get this one all the time. But the truth is, there isn't one "best" tool. The most insightful reports I've ever built didn't come from a single platform; they were a cocktail of data from a few different sources.
The best approach is to build your own "reporting stack." A fantastic starting point is Google Looker Studio. It's free, it's powerful, and you can build dashboards that pull data directly from Google Analytics and Search Console. For the deeper stuff, like competitive intelligence or backlink analysis, you'll want a paid tool. Both Ahrefs and Semrush have fantastic reporting modules built right in.
Don't obsess over finding a single, perfect tool. The goal is to combine the strengths of a few great ones to create a report that tells the whole story in a way your audience can actually understand.
Help! How Do I Report a Drop in Traffic or Rankings?
Okay, this is the one that gives every SEO a little pit in their stomach. But facing this head-on is a huge opportunity to build trust. The absolute golden rule is: be transparent and get ahead of it. Never, ever try to hide bad news.
First, you need to do your homework. Dig into what happened. Was there a big Google algorithm update? Did a technical glitch creep in after a recent site change? Or did a competitor just launch a massive campaign?
When you report it, present the data clearly and share your analysis of the likely cause. But here’s the most important part: immediately follow up with a confident, concrete plan of action. When you frame a dip as a challenge you already have a solution for, you turn a potential negative into a moment of leadership.
Ready to stop guessing and start strategizing? RankHub takes the manual labor out of keyword research. Our AI-driven platform analyzes your entire site to deliver high-value, relevant keywords and competitor insights in under a minute. Find your next winning keywords with RankHub today.
More from Our Blog
What the Data Shows About SEO Automation ROI in 2026
Discover real ROI data on SEO automation tools: 780% returns, 68% adoption, and how hybrid AI+human workflows drive results.
Read more →
How a Marketing Team Scaled Content Production With SEO Automation
See how one marketing team used SEO automation to triple content output, reduce production time by 60%, and increase organic traffic by 240% in 6 months.
Read more →
The Ultimate Guide to SEO Automation Platforms: Everything You Need to Know
Learn how SEO automation platforms save 60%+ of your time on rank tracking, content creation, and technical audits. Complete guide with tools and best practices.
Read more →